Windmill Software Chosen to Teach Process Control Technology
A new education initiative is using the Windmill Software demo to help explain control technology. You can download a free copy of this demo from here.
The Windmill Graphics simulation software was seen as essential for student's Information Technology core skills. The software lets students control a process from their PC screens. By pointing and clicking they can simulate closing drain valves, filling tanks, starting heating operations, and so on - thus familiarising themselves with process control software.
Other skills taught by the control technology kit include:
- using level control systems with digital sensors
- temperature control with digital and analogue sensors
- monitoring systems and
- data logging.
The Higher Still Development Unit has prepared and funded the education kit. They have distributed it to all Secondary Schools, Further Education Colleges and Teacher Education Institutes in Scotland, where it has been universally well received. Eventually they intend to distribute kits to every school in England.
The technological studies course introduces and develops knowledge, understanding and skills that underpin both vocational training and higher education in engineering. Examples from the oil and gas industry give real world contexts to the teaching at all levels in secondary schools and colleges. Central to the programme is that it enables Information Technology to be delivered and assessed in a real life context: an essential skill for young people considering further training and a career in engineering.

The Windmill Graphics program is used in schools and colleges to demonstrate process mimic software.
An extract from the Control Technology Education Kit
Guide to Using the Windmill Simulation Software
Accessing the Simulation Software
For these projects you will only need to use one aspect of the software however as you will see there are a number of facilities in this demonstration software that are directly relevant to control technology projects which might be done in 5-14, Standard Grade and Higher Still Projects.
For the purposes of the projects in this pack you will be using the Windmill Graphics part of the demonstration software.
How to access Windmill Graphics
Go to Start / Programmes / Demo Windmill / Windmill Graphics.
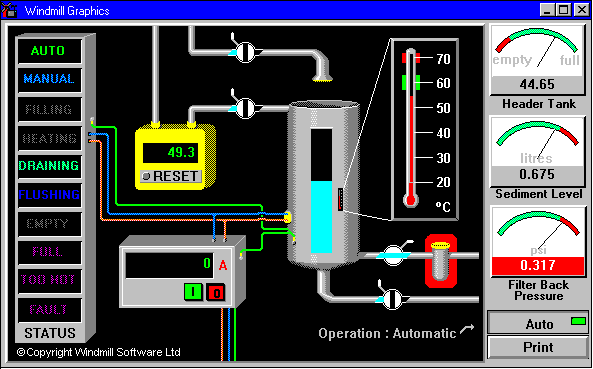
On your screen you will see a simulation of a temperature control process. At this time the process is operating fully automatically.
Description of the automatic process
Flushing
Observe how the valves control the flow of liquid to the tank. You will see that there are two valves at the top and two valves at the bottom. The TOPMOST valve flushes the system. When this is activated the valve will be in line with the pipe and you will see the tank being flushed. The lower of the two bottom valves is also open to allow the liquid to be drained. The status indicator on the left of the screen shows when FLUSHING is taking place. After flushing, both bottom valves are closed and the filling operation can begin.
Filling
Both of the bottom valves are closed, the valve that controls the flushing is also closed. This then allows the tank to be filled. As the tank is filling the yellow meter shows the volume of liquid in the tank. This part of the process is indicated in the status bar as FILLING. When the tank is full the filling valve is closed off and the heating process can begin. The status bar indicates FULL.
Heating
The grey meter indicates the current being drawn by the heating element. The temperature of the process is shown by the thermometer graphic. The status bar indicates when HEATING is taking place. This is an automatic temperature controlled process. Heating takes place until the required temperature is reached. When the required temperature is reached the product is drained off.
Draining
The second bottom valve allows the product to be drained away to the next stage of processing. The status bar indicates when DRAINING is taking place
You should also note that analogue displays are used to provide a visual indication of the status of the process. These show volume of liquid, sediment level and pressure. Below the meters an accurate digital value is also displayed.
Student activity
- Observe the automatic process until you are confident that you understand the process and the sequence of the process.
- After you have observed the automatic process you should control the process manually.
How to operate the simulation manually
To activate the manual control you should click on the button marked Auto whilst the tank is draining. This prompts you to: Click over valves and switches to turn on and off.
Now follow this process to flush, fill, heat and drain the system:
- Close the drain valve by clicking on it once
- Open the flush valve
- Open the empty valve
- Close the flush valve
- Fill the tank until the yellow gauge reads 46 then close the fill valve
- Start heating operation by pressing the green start button on the grey gauge (ammeter). Press the red button to stop the heating process when the temperature reaches 60 oC
- Open the drain valve to drain away the product
- Close the valve when empty is indicated on the status bar
- The process is ready to begin again.
The above extract was taken from the Control Technology in the Oil and Gas Industry Education Kit, produced by the Higher Still Development Programme in partnership with UKOOA, Grampian Education Business Partnership and Scottish Enterprise (Energy Division).
