
Monitor - ISSN 1472-0221
The Newsletter for PC-Based Data Acquisition and Control
Issue 218, October 2016
Welcome to Monitor, the data acquisition and control newsletter. Don't forget subscribers can download our measurement software, ComDebug, for free.
You can download Monitor as a pdf file from https://www.windmill.co.uk/monitor/monitor218.pdf.
Contents
* Filtering: Removing Interference from your Signal
* Your Questions Answered: Logging from Two Identical Instruments
* Excel Corner
* Data Acquisition News Round-up
Filtering: Removing Interference from your Signal
Weblink: https://www.windmill.co.uk/filter.html
Many analogue signals - temperature, pressure, strain, and so on - can benefit from some type of conditioning to improve the quality of measurement. Filtering is a type of conditioning which removes interference from your signals.
The data acquisition interface might filter the signal (analogue filtering); alternatively you could use analysis software for filtering. Here we are focusing primarily on analogue filtering in hardware.
For our purposes a filter is a device that removes undesired signals according to their frequency. If the frequency spectra of signals and interference are sufficiently different, filtering can be very effective.
Choosing the Right Type of Filter
High-Pass Filter
When a low-level transducer signal is superimposed on a large dc output voltage, a high-pass filter might be useful. This attenuates (removes) low frequencies. Using a cut-off frequency of, say, 4 Hz, will eliminate the dc voltage which has a frequency of zero.
A high-pass filter will remove "drift". This can be a particular problem with biological and chemical signals, but not usually with modern electronic signals.
Low-Pass Filter
More commonly used is a low-pass filter. This lets through the lower frequencies and attenuates the higher frequencies. Choose the cut-off frequency to be compatible with the unwanted frequencies, the frequencies present in the signal you are measuring and the sampling rate of the analogue-to-digital converter.
There are a number of other ways of removing high frequency noise from your signals. The amplifier itself has a high frequency cut-off. An integrating A-D converter will also act as a low-pass filter. Keeping signal wires as short as possible, using twisted together or shielded wires, keeping away from electrical machinery and using differential inputs will all help reduce interference.
Anti-Aliasing Filter
When recording a signal waveform, a computerised data acquisition system takes readings from (samples) the signal and interpolates for whatever the signal is doing between readings. Basically it joins up the dots to make a waveform. Too few dots and it can produce a totally misleading picture, showing a waveform with much too low a frequency. This is known as aliasing.
An example of aliasing is when stagecoach wheels on a film appear to be going backwards when the coach is actually travelling forwards. The camera samples the scene 24 times each second. This sampling rate is too slow for the speed of the spokes of the wheel. Instead of each frame showing the spokes a little bit further round, each spoke advances to just short of the original position of the spoke in front, giving the appearance of rotating backwards.
You can solve aliasing by making sure the sampling rate is at least twice the highest input frequency present in your signal (Nyquist Theorem). In practice it should be 10 to 20 times the highest frequency component of the real signal.
Angular waveform produced when the signal is sampled at twice its highest frequency. For a more accurate representation sample five to ten times this rate.
So where does filtering come in? Well, if you have high frequency interference and you sample according to the lower frequency of your signal, you will alias the interference - making it look like a part of the signal you are trying to measure. You can remove the interference using an anti-aliasing filter, which is a type of low-pass filter.
An anti-aliasing filter generally has a sharper cut-off than a normal low-pass filter. It is specified according to the sampling rate of the system and there should be one filter per input signal. For example, in data acquisition using a 12-bit analogue-to-digital converter, attenuation of -78 dB will get rid of signals that the converter can't resolve. Here are some guidelines for selecting the cut-off frequency of the filter.
| Signal Type | Cut-Off Frequency Criterion |
| pulsed dc | rate of change (V/sec)/1V |
| sinusoid | 1/period |
| complex periodic | 20/fundamental period |
| single events | 1/pulse width |
With suitable hardware you can set the cut-off frequency for high-pass, low-pass and anti-aliasing filters from Windmill software.
Band-Pass and Band-Stop Filters
A band-pass filter allows only a pre-defined frequency band through, whilst a band-stop (or notch) filter does the reverse - stopping a pre-defined frequency band. A band-pass filter might be useful when your signals are all at one frequency, and a band-stop when you want to remove mains interference. If your signal is 0-200 Hz, for example, you could use a band-stop filter to remove the 50 or 60 Hz mains band. This would slightly distort your measured signal but by much less than letting through the mains interference.
An integrating A-D converter, with the integration time chosen to be one full cycle of the line or mains voltage, could average the interference at the line frequency to zero. It would thus act as a band-stop filter.
Other Filtering Considerations
Speed: One Filter for Each Signal
Using any type of filter reduces the maximum sampling speed. This is because a filtered signal takes time to settle to its final value. Sharing a filter would increase the settling time proportional to the number of signal inputs. If you are using filters in high speed applications therefore, use hardware that has a filter for each input signal.
Post Collection Filtering
Provided the signal has been accurately recorded, in particular aliasing effects have been avoided, you can view the signal waveform on the computer screen and apply additional software filtering if required. For system development projects we tend to use software to review and post-process the acquired waveforms, which allows the design of common digital filter types.
Examples of Filtering in Practice
Most electronic measurement systems should require neither pre-digitisation filtering in hardware, nor post-capture filtering in software. However, where long leads are used, or in particularly noisy environments, or when recording from sensors that interact with the systems they are monitoring (such as electrochemical or biological sensors) then filtering might be needed.
Another class of applications where filtering is required is when comparisons are made between measurements made on different systems. Crash testing of automobile and aircraft components is an example. Here the specifications of the measurement system, in particular its frequency characteristics, are tightly controlled.

For measurements from crash test dummies, transducer amplifiers can be given different hardware filters: for example a low-pass filter of 1000 Hz (1 dB point) for the head accelerometers. Dummy torsos have greater inertia, so they have a lower frequency response and the chest accelerometers are specified to have a low-pass filter of 180 Hz. The sled itself has still greater inertia, so it is filtered at 60 Hz. We record the raw signal filtered at 180 Hz, and then do post recording filtering down to 60 Hz in software. Specifying the limits to the frequency response in this way means that complex calculations carried out on the recorded waveforms (for example Head Injury Criteria, HIC) can be compared between test laboratories.
For more information on filtering, or other data acquisition techniques, contact sales@biodataltd.com.
Your Questions Answered: Logging from Two Identical Instruments
Weblink: https://www.windmillsoft.com/
Question
Hello,
If I am using two identical instruments (Denver Instruments SI-403), should I create 2 separate instrument files, or should I use the same one for both in ComDebug?
Answer
If both instruments are connected to the computer at once, then create two instrument files.
Excel Corner
Web link: https://www.windmill.co.uk/excel/
If, in Excel, you create a link to a cell, eg =F3, then insert a column before column F, your formula will automatically change to =G3. This occurs even when you use absolute references like =$F$3. To prevent this change, use the INDIRECT function.
For example, if you wanted to sum part of a row of cells, instead of using
=SUM(F6:Z6)
you would use
=SUM(INDIRECT("F6:Z6"))
Now if you insert a new column the formula will still refer to the original values.
If you have a question about using spreadsheets for data acquisition and analysis - email monitor@windmillsoft.com.
DAQ News Round-up
Welcome to our round-up of the data acquisition and control news. If you would like to receive more timely DAQ news updates then follow us on Twitter - @DataAcquisition - or grab our rss feed.
'Robomussels' monitor climate change
Tiny robots have been helping researchers study how climate change affects biodiversity. The robomussels have the shape, size, and colour of actual mussels, with miniature built-in sensors that track temperatures inside the mussel beds.
Source: SCUBA News
http://news.scubatravel.co.uk/
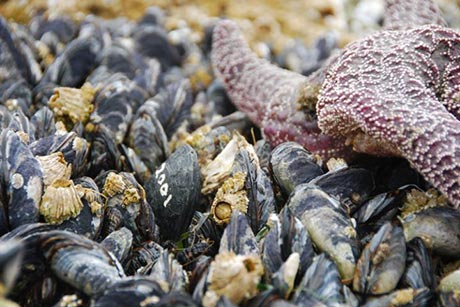
Robomussel, seen among living mussels and starfish. Photo credit: Allison Matzelle
Move Over, Solar: The Next Big Renewable Energy Source Could Be At Our Feet
When chemically-treated wood pulp nanofibers are embedded within flooring, they're able to produce electricity that can be harnessed to power lights or charge batteries. And because wood pulp is a cheap, abundant and renewable waste product of several industries, flooring that incorporates the new technology could be as affordable as conventional materials.
Source: University of Wisconsin-Madison
http://news.wisc.edu/
Flying drones could soon re-charge whilst airborne with new technology
Scientists have demonstrated a highly efficient method for wirelessly transferring power to a drone while it is flying.
Source: Imperial College London
http://www3.imperial.ac.uk/
Noise mapping offshore using wireless sensors
Improving the efficiency of noise surveillance and monitoring systems offshore.
Source: Process Control and Industrial Automation blog
https://nickdenbow.wordpress.com/
Global Market for RFID Technology on the Rise with Double-Digit Growth
Tags integrated with sensors are typically used with high-value, environmentally sensitive, or perishable objects whose value makes them worth the additional expense.
Source: bcc Research
"http://www.bccresearch.com/
* Copyright Windmill Software Ltd
* Reprinting permitted with this notice included
* For more articles see https://www.windmill.co.uk/
We are happy for you to copy and distribute this
newsletter, and use extracts from it on your own web
site or other publication, providing the above notice
is included and a link back to our website is in place.
For previous issues by subject see https://www.windmill.co.uk/monitorindex.html
DOWNLOAD DATA ACQUISITION SOFTWARE
As a thank you for subscribing we offer you the ComDebug data logging and Com port trouble-shooting software. Log data over RS232, RS422, RS485 or Modbus. Also included is a month's trial of the Windmill 7 logging, charting and control programs.
SUBSCRIBING OR CANCELLING SUBSCRIPTION Visit https://www.windmill.co.uk/newsletter.html and add or remove your e-mail address.
Windmill Software Ltd, PO Box 58, North District Office,
Manchester, M8 8QR, UK
Telephone: +44 (0)161 834 6688
Facsimile: +44 (0)161 833 2190
E-mail: monitor@windmillsoft.com
https://www.windmill.co.uk/
https://www.windmillsoft.com/