Regularly Logging a Vehicle's Fuel-Consumption, Emissions, Location, etc
With Windmill you can use your laptop to log and display your vehicle's fuel consumption, emissions, location and other parameters.
Vehicles now have an On Board Diagnostics (OBD) system. This monitors vehicle conditions and components that are related to vehicle emissions. The US and Canada has the OBDII system, Europe the EOBD system and Japan the JOBD system. You can interface any of these systems to your PC and use Windmill to automatically collect the data at regular intervals.
To connect your OBD system to the PC you need an interface. Although the On Board Diagnostics are standard across cars, the interface isn't: you need to buy an interface that matches your vehicle. You connect the interface between the car's 16-pin diagnostic port and, if you plan to use Windmill software, to the computer's COM port. (You may need a USB-serial converter if your computer is without COM ports.)
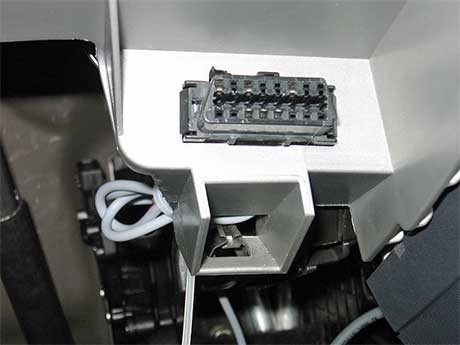
Image: M.Minderhoud/CC BY-SA 3.0
You now need some software to request data from the OBD system, read the response and log and display the data. If you wish to perform real-time calculations on the data, for example to see current fuel consumption, the software needs to be able to channel the data to a spreadsheet or similar program. Windmill software can do all these things and is currently free to our newsletter subscribers.
With Windmill you can interface several different devices, so you could add a GPS receiver to record location alongside your fuel consumption and emissions data.
Using Windmill | Getting the data into Excel | Application Story: Real-Time Fuel Consumption Monitoring | Understanding PIDs and the OBD Message Structure
Using Windmill Software
- Run the Windmill ComDebug program and enter the settings needed to communicate with your On Board Diagnostics interface.
- Optionally, run the Windmill SetupIML program and choose names and units for your data.
- Run the Windmill DDE Panel and Logger programs to send the data to Excel or log it to disk.
After you have entered your configuration settings with ComDebug and SetupIML, you don't need to use these again and can go straight to the logging and display programs. More details on entering the configuration settings are below.
Run the Windmill ComDebug program
This lets you configure Windmill to acquire data from your OBD device. Follow the general instructions in our Getting Started with ComDebug and the COMIML Serial Driver page, but enter settings specific to your OBD interface as follows.
COM Port Settings
These should work but check that they are the same as your interface is using.
| Comm Port: | Select the port to which your interface is connected. |
| Baud Rate: | 9600 |
| Data Bits: | 8 |
| Parity: | None |
| Flow Control: | None |
Data Format
Choose Add a new Message from ComDebug's Main Menu. This lets you send a message and view its reply. You need to define how to extract data. Each channel will have a specific task to request a specified piece of data from the interface. For each channel Windmill needs to send a command to request a reading, and extract that reading from the data string returned.
- In the Reply Parser window: enter the command needed to request a reading. For example, to request a vehicle speed reading from an ELM interface you would enter 01 0D \C013. 01 is the request for current data, 0D identifies you want the speed value and \C013 is a carriage return. For the carriage return use ComDebug's non-print menu. The 0D identifier is the PID or parameter identification number. See below for details of commands and PIDs.
- Extract menu: this is where you tell Windmill how to extract data from the response. In our vehicle speed example, the response would be in this format: 41 0D 37. We can ignore 41 0D as this just tells us that the speed value has been returned. The value we want is 37. So to extract 37 we could use ignore first 2 bytes then extract next 1. (See below for details of how many bytes are returned for each reading.)
- Repeat for the other channels.
Instrument Timings
In the Main Menu choose Edit the Instrument Timings. Enter your interface's settings. These depend on exactly what you want from your system, but these settings should get you started.
- Read in the Background
- Timeout: 1000 milliseconds
- Data Persistence: 5000 milliseconds (assuming you are taking readings more often than once every 5 seconds)
Read in the Background sets the device to request data and respond while working in the background. Windmill will "timeout" if no response is received in 1 second. The data persistence is how long the data will remain active. This must be longer than the rate at which you plan to read data.
Check your Settings
- In ComDebug click Run to check everything is working.
- Save your settings. From the Main Menu select Save .IMD file.
- In the opening screen click Edit Windmill Device. Press the Add button and select your instrument files. Press Make IMS. This creates a "hardware setup file" which the other Windmill programs will ask for the first time you use them. You can edit this with the SetupIML program if you wish: setting alarm levels, renaming channels, changing the engineering units, etc.
Run Windmill DDE Panel
- From the File menu select Load Hardware Setup and choose the *.ims file you just saved.
- Connect your channels (eg Speed). You should see your data in DDE Panel.
- Proceed similarly for the Logger and Chart programs.
Getting the data into Excel
The data collected is in hexadecimal format which you need to convert to decimal. To do this you will need a spreadsheet like Excel. You can use the Windmill Logger program to collect data, and after collection has finished import it into Excel. Alternatively, you can collect data with Excel in real-time (detailed on our Excel page). Use Excel's HEX2DEC command to convert to decimal.
Application Story: Real-Time Fuel Consumption Monitoring
Robert Kwiatkowski designed a real-time fuel consumption monitoring system for his truck. He connected his laptop to the On Board Diagnostics system of his Ford Expedition, used Windmill to collect data from the truck and Excel to calculate and display his current fuel consumption.
Most vehicles do not have a fuel flow sensor, therefore he used the Mass Air Flow (MAF) sensor and the
Vehicle Speed Sensor (VSS) to calculate miles per gallon (MPG).
1. Mass Air Flow - The mass of Air in grams per second consumed.
2. Vehicle Speed Sensor - The actual speed of the vehicle.
Vehicles use the oxygen sensors to feedback data to the vehicle's electronic control module (ECM) and control the air to fuel ratio. This ratio is set at the chemically ideal value of 14.7 grams of air to every gram of gasoline. He could use the known values to convert the MAF to Gallons of fuel per hour (GPH) and then calculate miles per gallon (MPG).
Here are the steps to make the conversion:
- Divide the MAF by 14.7 to get grams of fuel per second
- Divide result by 454 to get Lbs fuel per second
- Divide result by 6.701 Gals fuel per second
- Multiply result by 3600 to get gallons per hour
The expression for GPH is: MAF * 0.0805
To calculate MPG divide the MPH by GPH.
The final expression
for MPG will be:
VSS * 7.718
Robert Kwiatkowski has produced a step-by-step guide to replicating his system which he has kindly made available here.
Understanding PIDs and the OBD Message Structure
PID stands for parameter identification number. It is a hexadecimal number. For most PIDs (including all listed below) the value returned is also a hexadecimal number. One hexadecimal number is contained in each byte returned. So for a 1-byte message 2 characters would be returned, for a 2-byte message 4 characters would be returned.
PID Description                  Number of bytes  Scale   Offset   Units
                                 returned
05  Engine Coolant Temperature   1 byte           1       -40      oC
0A  Fuel Pressure                1 byte           3                kPa
0B  Intake Manifold Pressure     1 byte           1                kPa
0C  Engine RPM                   2 bytes          0.25             rpm
0D  Vehicle speed                1 byte           1                km/h
0E  Timing advance               1 byte           0.5     -64      degrees
0F  Intake air temperature       1 byte           1       -40      oC
10  MAF air flow rate            2 bytes          0.01             g/s
11  Throttle position            1 byte           0.3922           %
1F  Run time since engine start  2 bytes          1                s
23  Fuel Pressure (diesel)       1 byte           3                kPa
2F  Fuel Level Input             1 byte           0.3922           %
33  Barometric pressure	         1 byte           1                kPa
46  Ambient air temperature      1 byte           1       -40      oC
For a full list see an OBDII PID table.
Commands to Reqest Data: The Prompt String
The command to request data is made up of at least two components. The first specifies the mode of operation. There are nine modes of operation in the OBD standard, but for data logging you will generally use Mode 1: Show Current Data. The next component is the PID of the data you want. If you wanted to request the current mass air flow rate you would use: 0110 (01 for Mode 1, 10 for the PID). Depending on you interface you may need to add an end-of-message character. With ELM interfaces you would add a carriage return.