
Windmill Chart
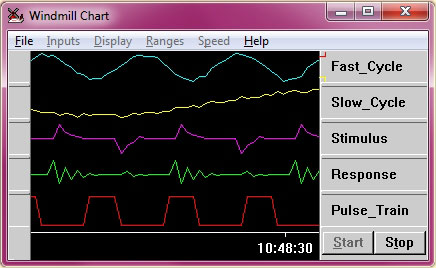
To chart your data just choose the Windmill Chart program. Select up to 8 channels from the list and press the Start button for a continuously updating graph. You can vary the speed so the window displays just the last few seconds in detail, or shows the trends over several hours.
There are various styles of chart, simply selected by push-buttons: separated or super-imposed traces; grid-lines on or off; choice of pen colour for each channel; black or white background; alarm indication; and so on.
Start more copies of Chart to see more channels, or connect the same channels to see both recent fluctuations and long term trends. You can transfer the chart image straight into a word processor for inclusion in a report, or get a direct print-out on your printer or plotter.
Chart handles many types of input channel, from many types of devices and sensors, including: thermocouples, pressure transducers, digital switches, flow meters and almost any laboratory instrument with an RS232 port.
Using Chart
- The first time you use Chart: from the File menu choose to load your hardware setup.
- Choose which channels you want to chart.
- Click Start.
- Stop the Chart when you want to save your settings, change the speed and change the way the chart is displayed.
For full details of using Chart select "Help" in the Chart window.