
Getting Started with ComDebug
The steps below will work with any device. We also have example settings for specific instruments, including those from Sartorius, Garmin, Mettler Toledo, Ohaus and Sylvac.
Steps to Take
- Create a Windmill Instrument File
- Enter communication settings
- Create channels to hold your data
- Enter any commands your instrument needs
- Extract data from the reply: parse the message
- Edit the instrument timings
- Check everything is working
- Save settings
- Create a Windmill Device
1. Create a Windmill Instrument File
From the Windmill start menu select ComDebug. From the opening screen select Create a new Windmill Instrument File.

The opening screen. The first time you use ComDebug select
Create a New Windmill Instrument File. Subsequently, when you
have saved settings, select Edit an Existing Windmill Instrument File.
2. Enter Communication Settings
Choose Serial (for RS232, RS485, RS422) or TCP/IP (for Ethernet) communications. (Modbus may be serial or TCP/IP.) Fill in your device's communication settings. For more on entering TCP/IP and Serial COM port settings see the ComDebug Help file, our TCP/IP Settings page or our COM Port Settings page. See also if we have example settings for your instrument.

Click the Help button if you are not sure of the settings to use.
The main menu appears.
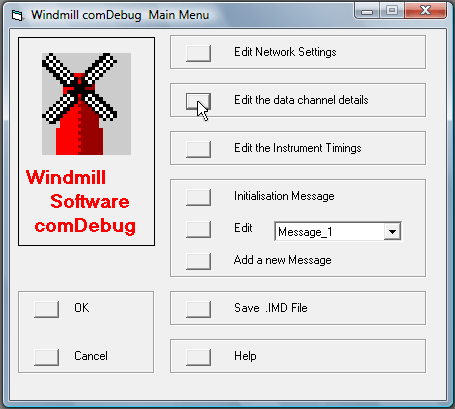
The Main Menu.
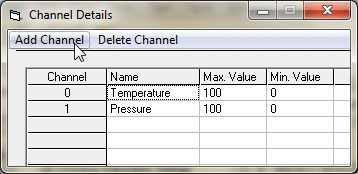
3. Create Channels to hold your data
Create Channels to hold your data. In the Main Menu select
Edit the data channel details.
Select Add Channel and type a name. This should be unique and not be duplicated across instruments.
Create a channel for each type of data: temperature, pressure, latitude, longitude, weight, etc.
You will later enter instructions for extracting this data and allocating it to the channel.
4. Enter any Commands your Instrument Needs
Choose Edit Message_1 from the Main Menu. This lets you send a message to your instrument and view its reply. (For subsequent instruments add a new message.) Make sure you DON'T select Initialisation Message instead. The Initialisation message is sent only once when the instrument is first switched on: it will not let you repeatedly collect data.
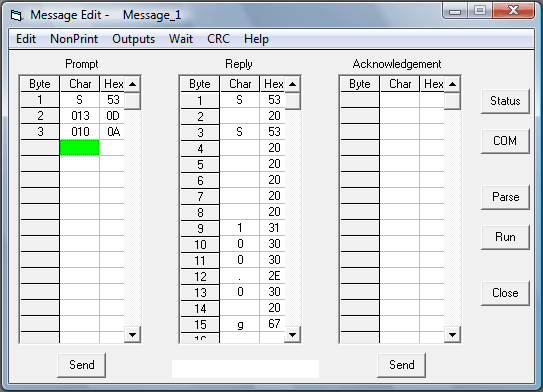
The Message screen lets you send commands and data to the instrument, and view the reply.
For those instruments that require it, you can send an acknowledgement when the reply is received.
Refer to your Instrument Manual for details of the command needed, or check whether we have
example settings for your instrument.
- If your instrument needs to be sent a command to return data, then type this command into the Prompt grid. If you need to enter characters not available from the keyboard, such as Returns or Linefeeds, use the NonPrint menu.
- If your instrument does not need to be sent any commands then leave the Prompt grid blank.
- Select Send. The instrument's reply is shown in the Reply grid. (If you do not see any reply - see our Trouble-Shooting Serial Port Communication tips.)
5. Extract data from the reply: parse the message
You need to tell ComDebug how to locate the data values in your instrument's message. To do this click the Parse button in the Message screen. Full details are in our Parsing notes.

Extracting Data from the reply: parsing the message.
- Click Add Action to search for characters and locate the position of your data in the message.
- Type the characters which ComDebug should look for into the Parameters box.
- Click over the next row then select Extract. The Channel Details box appears.
- Choose one of the channels you created earlier, or, if you haven't yet done so, add a channel now and select it.
- You are returned to the Reply Parser window to enter an Extract parameter. For instance, if you chose "Extract N Bytes" then type the number of bytes (characters) that you want to collect.
- Click Step to test the parsing. The data extracted is shown in the Value column.
- If this looks correct, close the Reply Parser. Otherwise edit your settings. See our Parsing Help page if you need more information on entering instructions to extract data. Also check whether we have example settings for your instrument.
6. Edit the Instrument Timings
In the Main Menu select Edit the Instrument Timings.

- If your instrument continually sends data without needing a command prompt, choose Read in the Background. Set both the Timeout and the Data Persistence Time to longer than the rate at which the instrument sends messages. The Instrument Idle Time is not used.
- If your instrument responds slowly to a request for data, choose Read in the Background. Set the Timeout to longer than the time taken to obtain a reply from the instrument. Set the Persistence Time to longer than your logging or charting interval. If your instrument dislikes being read too quickly, use the Instrument Idle Time to tell the ComIML serial driver to insert a delay between the end of one reading and the start of the next.
- If your instrument needs a command prompt to send data, and then responds quickly, choose Read Directly. Set the Data Persistence Time to less than the rate at which you want to read data. The Instrument Idle Time is used only if you insert a Wait command in the Prompt sting. Set the Timeout to longer than the time taken to obtain a reply from the instrument.
If in doubt choose Read in the Background. With Read in Background the Windmill ComIML driver continually listens for data from your instrument and stores the latest data value. When Windmill Logger - for example - then requests a reading the ComIML driver immediately sends its latest value. With Read Directly, the ComIML serial driver only takes reading from your instrument when Windmill Logger requests data. There is a short delay whilst ComIML waits for the instrument's reply and then passes it to Logger. See the Serial Port Driver Settings page for more details.
7. Check everything is working
In the Message Screen click Run to check that everything is working. If you are using ComDebug without the COMIML driver, select the File menu to save readings in a text file.
8. Save your Settings
Save your settings. From the Main Menu select Save .IMD file.
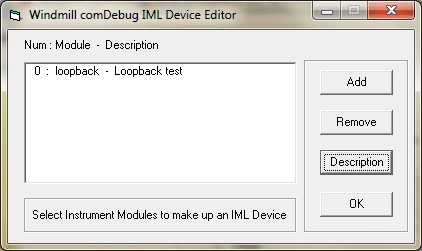
9. Create a Windmill Device
If you have a full version of the Windmill software then repeat steps 2 to 8 for any other instruments then click OK in ComDebug's Main window.
Windmill lists each instrument as a module within a Windmill COMIML Device.
In ComDebug's opening screen click Edit Windmill Device.

Press the Add button and select your instrument files (*.IMD). You should only have one *.IMD file per instrument. So if you are using just a balance, only one balance instrument file should be listed. If you had, say, a balance and pH meter then 2 instrument files should be listed.
If you haven't already done so, run ConfIML and add your COMIML device.
You are now ready to use the Windmill Logging, Display and Control programs. In the Windmill DDE Panel program for example, select Load Hardware Setup from the File menu. (If you can't find a hardware setup file run the SetupIML program to create an .ims file).
The next time you use Windmill you can go straight to this step: there is no need to run ComDebug again unless you need to add new devices.
Note, we now only sell Windmill with our data acquisition hardware.
Further Reading
The comdebug.chm file contains full instructions on using ComDebug and COMIML. To access this press the Help button during configuration then go to the Overview topic.
For more help see our Windmill 7 Technical Support page.
Related Pages:
Technical Support Notes
Making Measurements through the COM port
Trouble-shooting Serial Port Communication
Example Instrument Settings
RS232 Handshaking