When ComDebug shows the Data but Logger, DDE Panel and Chart do Not
ComIML is saying "Empty File"
You run ComIML and choose to Add the Serial Instrument Handler. You receive an error saying "Empty file - replace with your own IMD file". You need to go back to ComDebug and save a Windmill device.
I can see data in ComDebug but nothing in the other Windmill Programs
You've entered your parsing instructions, clicked Run and ComDebug displays the data correctly. However, Logger shows nothing at all.
The problem may be that you have entered an "Initialisation Message", which is only sent once, rather than a data collection message, which is repeatedly sent. Open your *.imd file. If it shows prompt and parse details for [Message0] Initialisation, but none for [Message1], just copy the Prompt and Parse lines from one to the other.
I can see data from some channels but not all
If you can see data from some channels but not all then make sure that all channel names are unique, including across several instruments.
I can see data in ComDebug but am getting "Bad IML device number" Error in Logger or SetupIML
- Make sure ComDebug is closed. Windows only allows one program to get control of a COM port and if ComDebug is running then SetupIML or Logger won't be able to access it.
- You may have added too many instrument files (*.imd) in ComDebug. There should be only one *.imd file for each instrument. For example, if you are logging from a GPS and a sonar you should see two *.imd files listed. To check: close any open Windmill applications, and any IML icons on the task bar. Now open ComDebug and choose to Edit a Windmill Device. Make sure the *.imd file for your instrument is listed. Remove any files that you no longer need.
- If you are using USB serial ports then Windows may have allocated them new com port numbers. Check in Control Panel - System.Hardware.Devices.Ports. The com port numbers should match those you selected in ComDebug
- If all else fails reboot the PC and run SetupIML or Logger as the first program.
Logger shows Error 114 - "Data not yet Ready" or "Data too Old"
When you press Run in ComDebug you see the data correctly, but Logger or DDE Panel gives error 114. This indicates that Windmill might not have received a reply from the instrument, or that new data isn't available.

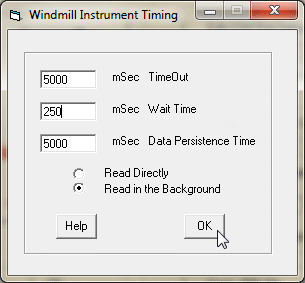
In ComDebug go to the Instrument Timing box and make sure that:
- The TimeOut is between five and ten times the normal response time. If you don't know the response time, 5000 milliseconds should be adequate.
- For instruments that continually send data, make sure the Data Persistence and Timeout are both longer than the rate at which the instrument sends messages and that you have chosen to read in the background.
- For instruments being read in the background that need a prompt to send data, make sure that the Data Persistence is longer than the sampling rate. If you are logging data every second, for example, set the data persistence to 2 seconds. See the ComDebug Help for more details.
- For instruments being read directly, set the Data Persistence Time to less than the rate at which you want to read data.
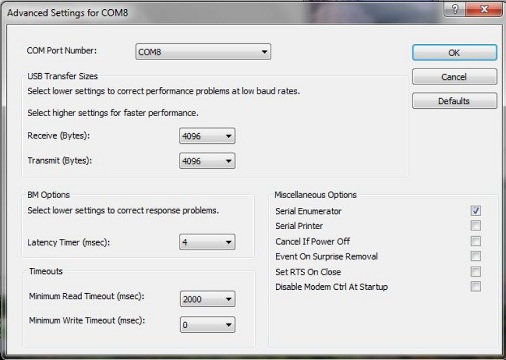
- If using a USB-Serial converter, and in ComDebug have chosen to "read in background", make sure that your converter is continually providing data, and not buffering it. Depending on your converter:
- Set the lowest latency possible
- Set the lowest USB Transfer sizes possible
- Set fast read and writes

- For more information on the problem, whilst Logger or DDE Panel is running open ComDebug and view the Windmill Debug Screen. See below for details.
Logger shows Error 105 - the Hardware is not Supplying Data
For serial instruments use ComDebug to check your settings. Choose to Edit an Instrument File then select Edit Instrument Timings.
For instruments that continuously send data, make sure that:
- Read in Background is checked
- Data Persistence is longer than the logging interval
- Instrument Idle or Wait Time is zero.
Logger shows AID Out of Memory
This occurs when you haven't added any devices in ConfIML.
Windmill Debug Screen
This screen displays debug messages from ComIML. To use the screen, first run a Windmill application such as DDE Panel or Logger. This will automatically start the ComIML handler and it will start sending out debug messages. Now start ComDebug and from the opening window click on Windmill Debug Screen. Messages will be displayed. You can click on Pause to stop the scrolling in order to examine the messages in detail.
Each Line starts with a number. This is a count of Milliseconds from the start of the Serial Message. It enables you see the time delays in getting a response from the instrument. A series of messages are supplied:
- 0 Start of Message Name
- This is sent when ComIML starts to implement a message.
- Send String
- Sent when ComIML transmits a Prompt or Acknowledgement string. Non print characters are shown as < 123 >.
- Start of Parse Attempt
- ComIML is starting its attempt to parse the reply message. Timeout measurement starts from here.
- Channel + Num + Value
- The value extracted by the parse.
- Parse OK
- The full parse string has been implemented on the Reply Message.
- Parse Timeout
- The Timeout value has been exceeded before a Reply satisfying the Parse has been received. To change the Timeout, from the Main Menu select Edit the Instrument Timings.
- Reply
- The Reply string that was available when the parse terminated.
- Channel + Num + Read
- Windmill caused a full reading of this channel.
- Channel + Num + Persist
- Windmill read the stored value of this channel because the persistence time had not yet expired.
- Flush Serial Buffer
- Before ComIML starts a new message it reads and discards any bytes remaining in the serial buffer. These are displayed. No message is displayed if there are no discarded bytes.
- Start of Wait Command
- Some instruments can become overloaded if instructions arrive too quickly. To prevent this you can tell ComIML to wait for the length of the Instrument Idle or Wait Time. The end of the wait is indicated by the next action specified by the message.
Differences between Direct and Background readings (set in ComDebug's Instrument Timings)
When a direct reading is being made, Windmill waits for the reply so the process continues until the reply is available or a Timeout occurs. In Background mode ComIML does not wait for replies to be received. Instead it allows other messages to be implemented (on different COM ports) and also services requests by Windmill. Whenever it returns to a Background reply it makes a fresh attempt to parse it. This means that you will see the early channels parsed several times before finally a complete parse is obtained.
In Background mode the idle time delay is enforced between the end of one read of the module and the start of the next. This appears as a Wait message.
Request Technical Support
Alternatively e-mail techsupp @ windmill.co.uk giving details of the problem. It will also help if you attach these files to the e-mail - *.imd, *.ims, and iml.ini - which you will find in your windmill directory.
Iml.ini is saved by ConfIML and lists the hardware drivers you have on your system: COMIML, SigGen, etc. The *.ims file is created by SetupIML and describes how you want to use your hardware: channel names, engineering units, alarm settings, etc. The *.imd files are created by ComDebug and contain the communications settings for your individual instruments: for example you might have a gps.imd containing the settings for a GPS and a balance.imd containing the settings for a weighing scale.
