
Monitor - ISSN 1472-0221
The Newsletter for PC-Based Data Acquisition and Control
Issue 220, December 2016
Welcome to Monitor, the data acquisition and control newsletter.
You can also download Monitor as a pdf file from https://www.windmill.co.uk/monitor/monitor220.pdf.
Contents
* Your Questions Answered: Is an external power supply needed when measuring strain?
* Excel Corner: How to highlight the highest value in each row
* Data Acquisition News Round-up
Your Questions Answered: Is an external power supply needed when measuring strain?
Weblink: https://www.windmillsoft.com/
Question
Hello Windmill,
I am very interested in your 751-SG system (for measuring strain), and was wondering if you could clarify a few questions for me.
Is there an excitation voltage provided by either the 751 / 594 unit, or does it require an external power supply?
Thank you,

Answer
For strain gauges you need an external excitation voltage that can supply sufficient current to keep all the bridge circuits energised.
The auxiliary channel of the 751 unit monitors this excitation voltage.
The Windmill software automatically reads the excitation voltage and performs the bridge calculation to produce a reading in microstrain. You can set a zero reference level and monitor changes relative to that level.
For a full description of how to measure strain see https://www.windmill.co.uk/strain-measurement.html
Excel Corner: How to Highlight the Highest Value in Each Row
Web link: https://www.windmill.co.uk/excel/
The screen shots here are taken with Excel 10: the method works for just about all versions.
There are a couple of ways to highlight the highest value in each row using Conditional Formatting.
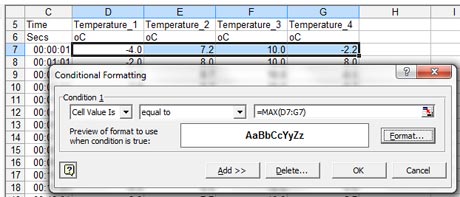
It's easy to highlight the highest value in just one row. Simply select the row and in the Conditional Formatting box choose
Cell Value Is and equal to. Type the maximum formula into the condition box - eg "=MAX(D7:G7)"
It's tedious to repeat this for every row though. The first solution I used was to insert a new column in which each cell showed the maximum value of its row, using the MAX formula. In our example in the image above, in Cell H you'd type =MAX(D7:G7). Copy this down to the bottom of the data table. Now select your data range, including the maximum value column. This time, in the Conditional Formatting box enter =$H7 (where $H is the column containing the maximum values).
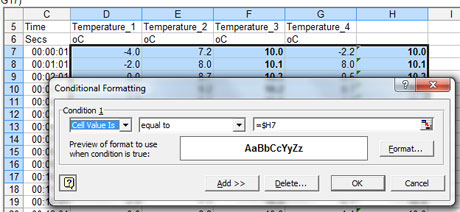
You can now hide the maximum value column.
A better way
Recently, though, I discovered an easier method: using a formula in the Conditional Formatting box -
=D7=MAX($D7:$G7)
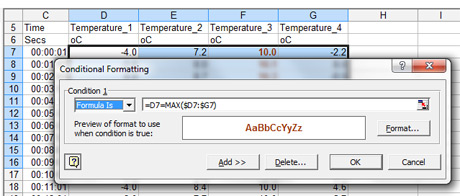
Where D7 is the first value in the range. This works because Conditional Formatting uses relative references. If you click on another cell in the range, say E10, and select Conditional Formatting, you will see that the formula is "=E10=MAX($D10:$G10)". It is checking whether E10 is the maximum value in the row D10 to G10.
Using this method you can dispense with the extra column - a more elegant solution.
Further Reading
Conditional formatting lets you highlight just about any condition, you just need a little imagination as to how to achieve it. More tips on condition formatting with Excel were given in issue 83 of Monitor, archived at https://www.windmill.co.uk/monitor83.html.
If you have a question about using spreadsheets for data acquisition and analysis - email monitor@windmillsoft.com.
DAQ News Round-up
Welcome to our round-up of the data acquisition and control news. If you would like to receive more timely DAQ news updates then follow us on Twitter - @DataAcquisition - or grab our rss feed.
Mix of Graphene With 'Silly Putty' Yields Extremely Sensitive Sensor
Mixing graphene - a material made of single-atom-thick layers of carbon - with homemade "Silly Putty" produces a sensor so sensitive that it can detect the tiny footsteps of spiders, according to new research.
Source: Trinity College Dublin
https://www.tcd.ie/
Learning Morse Code without Trying
Researchers at the Georgia Institute of Technology have developed a system that teaches people Morse code within four hours using a series of vibrations felt near the ear. Participants wearing Google Glass learned it without paying attention to the signals - they played games while feeling the taps and hearing the corresponding letters. After those few hours, they were 94 percent accurate keying a sentence that included every letter of the alphabet and 98 percent accurate writing codes for every letter.
Source: Georgia Tech
http://www.news.gatech.edu/
Phytoplankton Cycles Viewed Through Space-Based Sensor
Scientists succeeded in getting their first continuous look at the boom-bust cycles that drive polar plankton communities by using a space-based sensor capable of seeing through darkness, clouds and fog.
Source: A to Z of Sensors
http://www.azosensors.com/
Vehicles with sensors to control air quality in Glasgow
They can be deployed flexibly and rapidly in mobile configurations to complement static stations providing more capability to Smart Cities
Source: Sensors Mag
http://www.sensorsmag.com/
How to Plan, Install, and Maintain TCP/IP Ethernet Networks
ISA has published the third edition of the Industrial Ethernet publication. It covers new networking technologies, new hardware platforms, new software standards and new organizations
Source: ISA
https://www.isa.org/
* Copyright Windmill Software Ltd
* Reprinting permitted with this notice included
* For more articles see https://www.windmill.co.uk/
We are happy for you to copy and distribute this
newsletter, and use extracts from it on your own web
site or other publication, providing the above notice
is included and a link back to our website is in place.
For previous issues by subject see https://www.windmill.co.uk/monitorindex.html
DOWNLOAD DATA ACQUISITION SOFTWARE
As a thank you for subscribing we offer you the ComDebug data logging and Com port trouble-shooting software. Log data over RS232, RS422, RS485 or Modbus. Also included is a month's trial of the Windmill 7 logging, charting and control programs.
SUBSCRIBING OR CANCELLING SUBSCRIPTION Visit https://www.windmill.co.uk/newsletter.html and add or remove your e-mail address.
Windmill Software Ltd, PO Box 58, North District Office,
Manchester, M8 8QR, UK
Telephone: +44 (0)161 834 6688
Facsimile: +44 (0)161 833 2190
E-mail: monitor@windmillsoft.com
https://www.windmill.co.uk/
https://www.windmillsoft.com/