
Monitor - ISSN 1472-0221
The Newsletter for Data Acquisition and Control
Issue 265 November 2020
Hello and thank you for subscribing. I hope you find the newsletter useful. This month an overview of smart cities, with a discussion of the communications, devices and sensors used in them to come in a later issue. Comments to monitor@windmillsoft.com.
You can download a pdf copy of this newsletter here.
Contents
* What makes a city smart?
* Your DAQ Questions Answered
* Data Acquisition News Round-Up
What makes a city smart?
A smart city doesn't become "smart" overnight - it's a continual process. And there are many interpretations of a smart city, such as
- A smart city provides open data
- A successful smart city needs the involvement of stakeholders
- A smart city is connected
1. Open Data
Sharing data is essential for a city to be smart. Sharing data within the city but also sharing data between cities. It can benefit citizens, industry, services, retail, businesses, the public and private sectors. We’re not saying that all data should be released to everyone – smart city systems have the capability to integrate and make data available from all different areas as and when required.
Sharing data can result in better transport, reduction in pollution, healthier lives, energy saving and many other benefits.
2. Collaboration and Involvement of Stakeholders
Smart cities are there to benefit people. They show visible results for citizens and stakeholders. Some will be immediately obvious, others, in areas like healthcare may take longer. Monitoring traffic and transport is one example of a component of a smart city. Sharing information - like which car parks are full - is an immediate result. Knowing exactly how much traffic is on which streets at any time opens opportunities for cities to give the information directly to the public.
Counting passengers on buses informs transport authorities of the numbers of people arriving by bus at various points in the city, by time of day. The data helps revenue protection - reconciling tickets bought with passenger numbers. It also enables effective fleet bus management with services around the city centre. Importantly, today, live occupancy figures for each bus can be supplied on apps and screens.
The smart city data helps quantify the use of footpaths and cycle ways. It shows the use of roads, including commuter routes around schools and major routes through the city centre. Creating a city that uses technology to meet the complex needs of its people and driving urban planning to make the city easier to navigate by foot or bicycle. Automatic, continual, collection of data enables analysis of change over time.
Asking people in organisations which projects are most important to them helps direct the direction of the growth of a smart city. Like any project – taking people along with you makes everything easier. Importantly today, live occupancy numbers for each bus can be supplied on apps and screens.
3. Understanding the Technology behind Smart City Connections
For a city to be smart it needs to be connected. It needs the digital infrastructure transmit the smart city data and make it available to interested parties. For example, sensors and devices around the city might collect data and upload it wirelessly to "brokers". The brokers process this data and then make the information available to everyone who needs it, in the format they need it in. A scaleable platform which grows as needed.

There are many communication networks and protocols which cities can use – Ethernet, Wi-Fi, 4g, LoRa Wide Area Network (WAN) for IoT, SigFox, MQTT and so on. The Microlink data loggers Windmill sell, for example, can use MQTT, Ethernet or Wi-Fi.
Your Data Acquisition Questions Answered:
Question
Hello,
I am interested in one of your entry level data loggers for engineering test use. Specifically looking at model 750. Could you email the manual or send me a download link?.
I also have a couple of questions.
- Does the 750 have the same screw terminal connections for input signals like the ML840?
- Is the data logger software same for the model 840 and 750? (The ML840 is another model I am considering). If they are different, can they be installed on the same machine without a conflict?
PS: Like your newsletter very much (long time subscriber) and this is the first time I checked out your product line and very impressed with your hardware-software offerings.
Answer
Thanks very much for your query and comments. Each Windmill 750 lets you monitor 16 analogue voltage inputs, 16 digital inputs & outputs and 8 counters. You can download the manual here.
It has pin connections for the analogue and digital channels. The software is the same for the different hardware models. You can save different set-ups for each configuration and just load the one you are using this time.
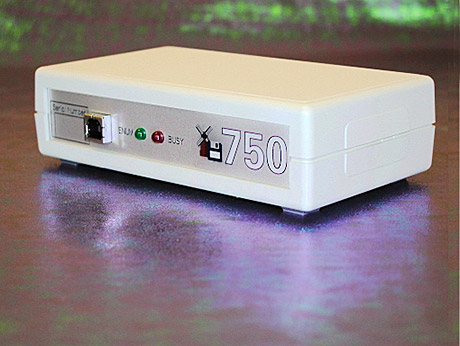
For more on the Microlink 750 see https://www.windmillsoft.com/daqshop/analogue-input.html or contact sales@biodataltd.com.
DAQ News Round-up
Welcome to our round-up of the data acquisition and control news. If you would like to receive more timely DAQ news updates then follow us on Twitter - @DataAcquisition - or grab our rss feed.
Implantable sensor could measure bodily functions -- and then safely biodegrade
An international team of researchers has designed a highly sensitive flexible gas sensor that can be implanted in the body and, after it's no longer needed, safely biodegrade into materials that are absorbed by the body.
Source: Penn State
https://news.psu.edu/
Computer vision can estimate calorie content of food at a glance
Scientists at Karlsruhe Institute of Technology have harnessed a neural network to estimate the calorie content of a meal from a photo of it.
Source: New Scientist
https://www.newscientist.com/
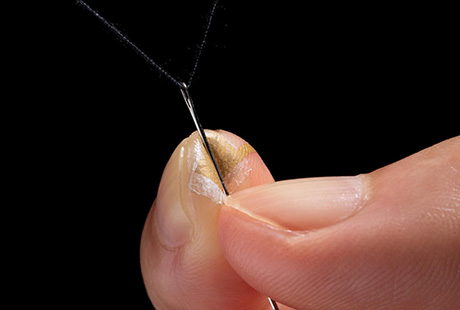
A pressure sensor at your fingertips
Researchers have developed an ultrathin pressure sensor that can be attached directly to the skin. It can measure how fingers interact with objects to produce useful data for medical and technological applications.
Source: Eureka Alert
https://www.eurekalert.org/
Underwater use beckons for neuromorphic cameras
Western Sydney University are adapting their neuromorphic cameras for underwater use. They work differently to regular cameras, and are sensors more like the brain and the eye.
Source: SCUBA News
https://news.scubatravel.co.uk/
* Copyright Windmill Software Ltd
* Reprinting permitted with this notice included
* For more articles see https://www.windmill.co.uk/
We are happy for you to copy and distribute this
newsletter, and use extracts from it on your own web
site or other publication, providing the above notice
is included and a link back to our website is in place.
For previous issues by subject see https://www.windmill.co.uk/monitorindex.html
SUBSCRIBING OR CANCELLING SUBSCRIPTION Visit https://www.windmill.co.uk/newsletter.html and add or remove your e-mail address.
Windmill Software Ltd, PO Box 58, North District Office,
Manchester, M8 8QR, UK
Telephone: +44 (0)161 834 6688
Facsimile: +44 (0)161 833 2190
E-mail: monitor@windmillsoft.com
https://www.windmill.co.uk/
https://www.windmillsoft.com/