How to display Excel data on Google Earth: Excel to KML
You can show spatially referenced data from Excel on Google Earth, and even a moving track of data over time. To do this you need to collect latitude and longitude readings from a GPS receiver alongside other measurement data such as depth or temperature.
For example, you might be measuring conditions on a moving train: any wheel slip in poor weather for example. With a Windmill system you could record co-ordinates from a GPS receiver, data from the wheel-slip detection mechanism, wheel speeds and other details.
Let's assume that you've collected your data and it is in an Excel spreadsheet. You now need to create a 'KML' file from your data.
KML is a file format used to display geographic data in applications such as Google Earth or Google Maps. It is a text file based on the XML standard.
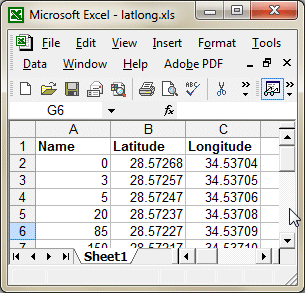
Before you can convert your Excel file to KML, you have to arrange your worksheet in a specific way. It should contain at least 3 columns: latitude, longitude and your data - for example depth. Change the title of the data column to Name.

The first column is depth data (m), collected by Windmill software reading sonar data.
Windmill grabbed the latitude and longitude data from a GPS receiver.
There are several utilities out there that will convert your Excel file to KML for you. I like Earth Point's offering at http://www.earthpoint.us/ExcelToKml.aspx. Some others are listed below.To use the Earth Point tool:
- Look for the Choose File button on their web page, and browse to your Excel file.
- Click "View on Google Earth". The Earth Point utility will save your file as a KML file.
- Open Google Earth on your PC.
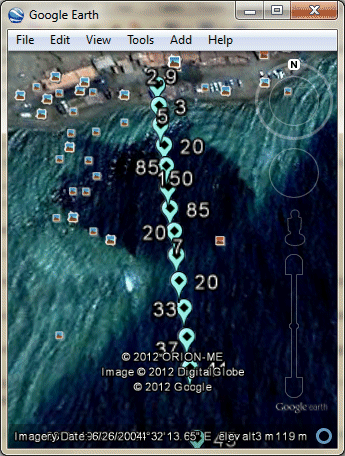
- From the Google Earth File menu, open the file you have just saved. Your data will be overlaid as labelled points.

Adding More Information to the Google Earth Overlay
You can add other columns to your spreadsheet, providing more details. For example, if you add a column titled "Description", whatever you type here will appear in Google Earth as a pop-up balloon.
You can also show a moving track of data over time.
Showing a Moving Track of Data in Google Earth
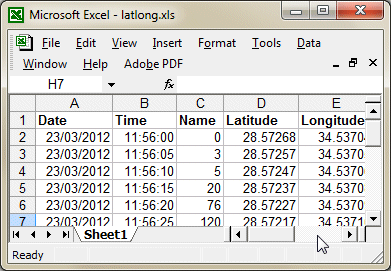
To show moving tracks on Google Earth you also need a column in Excel headed "TimeWhen". Windmill saves two columns of time data: one containing the date and one containing the time

You need to combine these into one in the format:
2012-03-22T07:30:15Z
Where
T separates the date from the time.
Z indicates that the time is UTC (Greenwich Mean Time)
If your time zone is different, instead of Z put - for example - +03:00. More details are at https://developers.google.com/kml/documentation/kmlreference#timestamp.
In Excel...
-
Combine the contents of the date and time columns into 1 new column, eg column F.
- In an empty column in Excel enter this formula :
=TEXT(A2,"yyyy-mm-dd")&"T"&TEXT(B2,"hh:mm:ss")&"Z"
This combines the date and time, adds a "T" between them and formats the result as text. - Copy the formula down for each row.
- Select all the new date/time entries and copy them to the clipboard.
- Click cell A2, from the Edit menu select Paste Special.
- Paste as values.
- You can now delete the Time column and column F.
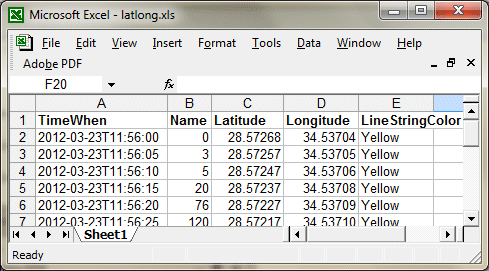
- Change the title of Column A from "Date" to "TimeWhen"
- Finally, add a new column with the title "LineStringColor".
Fill the rows in this column with the name of a colour, for example Yellow.

More Excel Tips and Tricks
Our free Monitor newsletter (ISSN 1472-0221) features a series of Excel Corners, giving hints and tips on using Excel. To subscribe to Monitor fill in your e-mail below.
Further Reading
- Excel to KML Tools and Macros
- Earthpoint
- Inquiron: Very easy to use, just upload your Excel file and save the resulting kml
I Programmer: a VBA program
tchart development: a free utility to convert csv files to kml format
Excel to Google Earth KML - Inquiron: Very easy to use, just upload your Excel file and save the resulting kml
