Monitor - ISSN 1472-0221
The Newsletter for Data Acquisition and Control
Issue 298 February 2024
Welcome to Monitor, thank you for subscribing. For your free subscriber's copy of Windmill data acquisition software email monitor@windmillsoft.com.
You can download Monitor as a pdf file from https://www.windmill.co.uk/monitor/monitor298.pdf.
Contents
* Filtering: how to remove interference from your signal
* Your DAQ questions answered: logging temperature, position and depth
Filtering: How to Remove Interference from your Signal
Web link: https://www.windmill.co.uk/filter.html
Many analogue signals - temperature, pressure, strain, and so on - can benefit from some type of conditioning to improve the quality of measurement. Filtering is a type of conditioning which removes interference from your signals.
The data acquisition interface might filter the signal (analogue filtering); alternatively you could use analysis software for filtering. Here we are focusing primarily on analogue filtering in hardware, although you can use Windmill data acquisition software to set such filtering.
For our purposes a filter is a device that removes undesired signals according to their frequency. If the frequency spectra of signals and interference are sufficiently different, filtering can be very effective.
- Choosing the Right Type of Filter: high pass, low pass, anti-aliasing, band pass, band stop
- Other filtering considerations: speed, post-collection
- Examples of Filtering in Practice
Choosing the Right Type of Filter
High-Pass Filter
When a low-level transducer signal is superimposed on a large dc output voltage, a high-pass filter might be useful. This attenuates (removes) low frequencies. Using a cut-off frequency of, say, 4 Hz, will eliminate the dc voltage which has a frequency of zero.
A high-pass filter will remove "drift". This can be a particular problem with biological and chemical signals, but not usually with electronic signals.
Low-Pass Filter
More commonly used is a low-pass filter. This lets through the lower frequencies and attenuates the higher frequencies. Choose the cut-off frequency to be compatible with the unwanted frequencies, the frequencies present in the signal you are measuring and the sampling rate of the analogue-to-digital converter.
There are a number of other ways of removing high frequency noise from your signals. The amplifier itself has a high frequency cut-off. An integrating A-D converter, such as used with our Microlink 751 DAQ unit, will also act as a low-pass filter. Keeping signal wires as short as possible, using twisted together or shielded wires, keeping away from electrical machinery and using differential inputs will all help reduce interference.
Anti-Aliasing Filter
When recording a signal waveform, a computerised data acquisition system takes readings from (samples) the signal and interpolates for whatever the signal is doing between readings. Basically it joins up the dots to make a waveform. Too few dots and it can produce a totally misleading picture, showing a waveform with much too low a frequency. This is known as aliasing.
An example of aliasing is when stagecoach wheels on an old film appear to be going backwards when the coach is actually travelling forwards. The camera samples the scene 24 times each second. This sampling rate is too slow for the speed of the spokes of the wheel. Instead of each frame showing the spokes a little bit further round, each spoke advances to just short of the original position of the spoke in front, giving the appearance of rotating backwards.
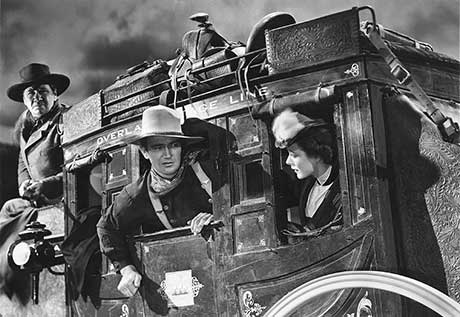
From the film Stagecoach by United Artists
You can solve aliasing by making sure the sampling rate is at least twice the highest input frequency present in your signal (Nyquist Theorem). In practice it should be 10 to 20 times the highest frequency component of the real signal.
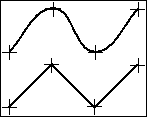
Angular waveform produced when the signal is sampled at twice its highest frequency. For a more accurate representation sample five to ten times this rate.
So where does filtering come in? Well, if you have high frequency interference and you sample according to the lower frequency of your signal, you will alias the interference - making it look like a part of the signal you are trying to measure. You can remove the interference using an anti-aliasing filter, which is a type of low-pass filter.
An anti-aliasing filter generally has a sharper cut-off than a normal low-pass filter. It is specified according to the sampling rate of the system and there should be one filter per input signal. For example, in data acquisition using a 12-bit analogue-to-digital converter, attenuation of -78 dB will get rid of signals that the converter can't resolve. Here are some guidelines for selecting the cut-off frequency of the filter.
| Signal Type | Cut-Off Frequency Criterion |
| pulsed dc | rate of change (V/sec)/1V |
| sinusoid | 1/period |
| complex periodic | 20/fundamental period |
| single events | 1/pulse width |
With suitable hardware, such as with the Microlink 590 signal conditioning unit, you can set the cut-off frequency for high-pass, low-pass and anti-aliasing filters from Windmill software.
Band-Pass and Band-Stop Filters
A band-pass filter allows only a pre-defined frequency band through, whilst a band-stop (or notch) filter does the reverse - stopping a pre-defined frequency band. A band-pass filter might be useful when your signals are all at one frequency, and a band-stop when you want to remove mains interference. If your signal is 0-200 Hz, for example, you could use a band-stop filter to remove the 50 or 60 Hz mains band. This would slightly distort your measured signal but by much less than letting through the mains interference.
An integrating A-D converter, with the integration time chosen to be one full cycle of the line or mains voltage, could average the interference at the line frequency to zero. It would thus act as a band-stop filter.
Other Filtering Considerations
Speed: One Filter for Each Signal
Using any type of filter reduces the maximum sampling speed. This is because a filtered signal takes time to settle to its final value. Sharing a filter would increase the settling time proportional to the number of signal inputs. If you are using filters in high speed applications therefore, use hardware that has a filter for each input signal.
Post-Collection Filtering
Provided the signal has been accurately recorded, in particular aliasing effects have been avoided, you can view the signal waveform on the computer screen and apply additional software filtering if required. For system development projects we tend to use software to review and post-process the acquired waveforms, which allows the design of common digital filter types.
Examples of Filtering in Practice
Most electronic measurement systems should require neither pre-digitisation filtering in hardware, nor post-capture filtering in software. However, where long leads are used, or in particularly noisy environments, or when recording from sensors that interact with the systems they are monitoring (such as electrochemical or biological sensors) then filtering might be needed.
Another class of applications where filtering is required is when comparisons are made between measurements made on different systems. Crash testing of automobile and aircraft components is an example. Here the specifications of the measurement system, in particular its frequency characteristics, are tightly controlled.

Lin Pan, CC BY-SA 3.0
For measurements from crash test dummies, transducer amplifiers can be given different hardware filters: for example a low-pass filter of 1000 Hz (1 dB point) for the head accelerometers. Dummy torsos have greater inertia, so they have a lower frequency response and the chest accelerometers are specified to have a low-pass filter of 180 Hz.
For more information on filtering, or other data acquisition techniques, contact sales@windmill.co.uk.
Your DAQ Questions Answered: Logging Temperature, Position and Depth
Question
"I want to collect data from sonar transducer (NMEA 183) on PC simultaneously with GPS (Trimble R8) position and temperature of a river. Your software seems to be ideal. I want to have synchronous reading of position and depth, position and temperature and preferably all together. Writing to a file x, y, z, depth temp. "
Answer
You can use the free Windmill software to do this. It will collect data from the three devices and simultaneously log all the readings. You can set the software to automatically collect the data every few seconds. You can export the data to Excel, or other analyis package.
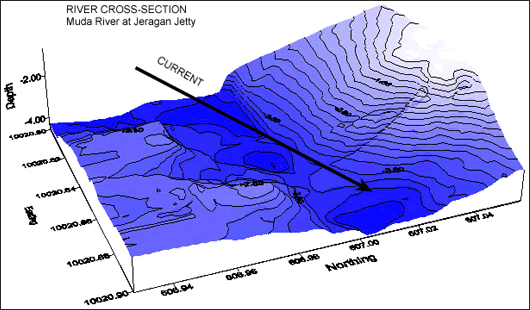
Map produced using data collected by Windmill, GPS and Sonar.
To receive your copy of the software just email monitor@windmillsoft.com. See the Windmill web site for details of reading GPS receivers and other NMEA devices.