
Monitor - ISSN 1472-0221
The Newsletter for PC-Based Data Acquisition and Control
Issue 215, July 2016
Welcome to Monitor, the data acquisition and control newsletter. Any questions email monitor@windmillsoft.com
You can download Monitor as a pdf file here.
![]()
![]()
![]()
Contents
* Signal Conditioning Explained
* Windmill Question: Measuring Current and Temperature
* Excel Corner: Automatically updating a Chart with Live Data
* DAQ News Round-up
Signal Conditioning Explained
Web link: https://www.windmill.co.uk/signal-conditioning.html
Signal conditioning is the technique of making a signal from a sensor or transducer suitable for processing by data acquisition equipment.
For example, if you were measuring a voltage signal smaller than a few millivolts, you might need to amplify it. If you had a signal contaminated with noise you could filter it.
Proper signal conditioning is essential in getting an accurate measurement of your signal. It is the first step of computerised data acquisition.
Types of Signal Conditioning
AMPLIFICATION
Amplification increases a voltage signal to a level suitable for digitisation by the DAQ equipment. Typically a data acquisition device is calibrated for input voltages in the 0 to 10 V range. A small voltage, such as that coming from a thermocouple or strain gauge bridge may need to be amplified 1000 times to make it between 0 and 10 V. Our data acquisition systems have programmable amplifiers.
If your signal is larger than the maximum input range then you will have to divide the signal down using a resistor network.

Dividing down a 0–100 V signal to 0–10 V
EXCITATION
Many transducers, like strain gauges and RTDs (resistance temperature devices), need a power supply. The signal from these transducers is either a voltage or a mA current. For many transducers the supply will be low voltage DC, but for transducers based on capacitance measurement an AC supply may be required.
Our systems can be equipped with power supplies suitable for providing the excitation voltage(s) required. Because the choice of power supply will depend on the number and type of transducers, you should draw up a list of transducers and their excitation requirements. The information needed includes voltage range and current requirements, and for AC excitation voltages, the frequency used.
Excitation is commonly needed for measuring force, pressure, relative humidity, temperature, level, light level, concentration and vibration.
LINEARISATION
Linearisation is needed when the signals produced by a sensor don't have a straight-line relationship with the physical measurement, as is the case when using thermocouples to measure temperature. Linearisation is sometimes achieved using signal conditioning. Windmill data acquisition software, though, has built-in linearisation for B, E, J, K, N, R, S and T type thermocouples so no prior signal conditioning is needed.
COLD-JUNCTION COMPENSATION
Thermocouples are popular temperature sensors because they are cheap, versatile and sturdy. They consist of two dissimilar metals joined together, making a continuous circuit. If one junction has a different temperature to the other, an electromotive force (voltage) is set up. This voltage varies with the temperature difference between the junctions. If the temperature at one junction is known, the temperature at the other junction can be calculated.
The system depends on knowing the temperature of one of the thermocouple junctions - the cold junction. Housing this junction in an isothermal box keeps the temperature constant, and a cold junction sensor in the box tells the system the temperature. Windmill systems automatically compensate for the cold-junction temperature in software.
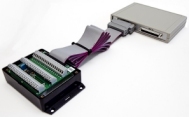
A cold-junction measuring box connected to data acquisition hardware
FILTERING
Filtering reduces noise errors in the signal. For most applications a low-pass filter is used. This allows through the lower frequency components but attenuates the higher frequencies. The cut-off frequency must be compatible with the frequencies present in the actual signal (as opposed to possible contamination by noise) and the sampling rate used for the A-D conversion.
A low-pass filter that's used to prevent higher frequencies, in either the signal or noise, from introducing distortion into the digitised signal is known as an anti-aliasing filter. These generally have a sharper cut-off than the normal low-pass filter used to condition a signal. Anti-aliasing filters are specified according to the sampling rate of the system and there must be one filter per input signal. They are commonly used when measuring, for example, vibration.
You can use Windmill software to enable and disable filters in the data acquisition hardware.
ISOLATION
A high transient voltage at one input may damage not only the input circuit, but an also propagate to other equipment connected to that input. You can prevent this type of damage by providing isolation between inputs.
HIGH IMPEDANCE
Certain types of transducer have a very high output impedance and are not able to supply enough current to use a normal voltage input. When connected to a normal amplifier, the currents drawn from the transducer can seriously distort the input signal. Typically glass electrodes used to measure pH, or gas concentration probes, are of this type. You should connect them to a voltage measuring circuit with a very high input impedance.
RMS SIGNAL CONDITIONING
You can monitor signals from electrical power supplies when the current signal is sensed with a current-sensing resistor, and high voltage signals are divided down using resistive dividers. Software scaling functions in Windmill turn your low-voltage readings back to the original power supply voltage and current values.
Since many power supplies provide an AC signal, a signal conditioning input which provides a DC signal proportional to the root mean square (rms) amplitude of the input signal would be suitable.
More Information
For more information on conditioning your signals please get in touch - email sales@biodataltd.com or call +44(0)161 833 2190.
Windmill Question: Can I Measure Current and Temperature with One Box?
Question
Weblink: https://www.windmillsoft.com/
We have a pilot plant where we use data loggers. The Microlink 751 looks like a really good buy! I need to record 8 thermocouple inputs and 8 current inputs at the same time. Do I need to get both a 593 thermocouple connection box and a 590-8A current connection box to do so?
Answer
As we manufacture the 593 and 590-8A boxes, we can make you a customised box which is a mixture of the two. So you could have one connection box which lets you connect 8 thermocouples and 8 current inputs.
Excel Corner: Automatically Updating Charts
When using Excel to display data in real- time, you may find it useful to also automatically update a chart in Excel.
Suppose you wanted to plot data in column A against the data in column B. You could simply insert a chart with the range
=$A:$B
As the data arrives, the chart will automatically update. However, if the rows of data exceed the original size of the worksheet, the chart will stop.
You can get round this by using Excel's CountA and Offset functions. CountA gives you the number of non-blank cells in a column. With Windmill data this equates to the number of rows of data (and headings). Offset returns a cell reference according to your settings. Using CountA as the height of the column gives a reference to the bottom row. This reference will automatically update when new data arrives.
For example, this is the syntax of Offset:
OFFSET(reference, rows, cols, height, width)
which becomes:
OFFSET(Sheet1!$A$1,0,0,COUNTA(Sheet1!$A:$A))
(assuming your data is in a worksheet called "Sheet1").
To implement this, using our previous example of plotting column A against column B.
- Create 2 named ranges called ColA and ColB (for
example).
For Column A, from the Insert menu choose Name then Define. In the names box type ColA and in the Refers to box type
=OFFSET(Sheet1!$A$1,0,0,COUNTA(Sheet1!$A:$A))Press Add For Column B, in the names box type ColB and in the Refers to box type=OFFSET(Sheet1!$B$1,0,0,COUNTA(Sheet1!$B:$B))
Press Add and close the dialogue box. - Insert a chart plotting Column A against Column B.
- We now need to edit the chart so it automatically
updates. Select the chart, right-click the
plotted data series and select Source Data. Replace
the current X Values with
=Sheet1!ColA
Replace the Y values with =Sheet1!ColB
(In the in the formula bar this will look like:
=SERIES(,Sheet1!ColA,Sheet1!ColB,1) - Click off the chart and start importing data into Excel. The chart will continually update no matter how many rows of data you collect.
For details of getting live data from Windmill into Excel, see https://www.windmill.co.uk/excel/ For more on charting with Excel see https://www.windmill.co.uk/excel/excel-charting.html
DAQ News Round-up
Welcome to our round-up of the data acquisition and control news. If you would like to receive more timely DAQ news updates then follow us on Twitter - @DataAcquisition - or grab our rss feed.
Theoretical Climbing Rope Could Slow Falls
University of Utah mathematicians showed it is theoretically possible to design ideal climbing ropes to safely slow falling rock and mountain climbers like brakes decelerate a car. They hope someone develops a material to turn theory into reality.
Source: Newswise
http://www.newswise.com/

Credit: Justin Boyer, University of Utah
Toward Real-Time Measurements for Real-Time Decision Making
Countries around the world are working to reduce these emissions, and decision-makers need real-time feedback on how well their efforts are working. For this reason, accurately measuring emissions is more important than ever. NIST's Greenhouse Gas and Climate Science Measurements Program is developing standards and methods for measuring GHG emissions directly based on atmospheric observations taken from surface stations, aircraft and satellites.
Source: NIST
https://www.nist.gov/
Sensing trouble: A new way to detect hidden damage in bridges, roads
Aging, deterioration and extreme events like earthquakes and hurricanes can take a toll on roads, bridges and other structures. With damage and defects often invisible, the search is on for systems that can monitor the health of structures and alert their owners to potential problems and even impending catastrophic failure.
Source: Eureka Alert
http://www.eurekalert.org/
Engineered "Sand" May Help Cool Electronic Devices
The bottom line could be a potentially new class of high thermal conductivity materials useful for heat dissipation from power electronics, LEDs and other applications with high heat fluxes.
Source: Georgia Tech
http://www.news.gatech.edu/
* Copyright Windmill Software Ltd
* Reprinting permitted with this notice included
* For more articles see https://www.windmill.co.uk/
We are happy for you to copy and distribute this
newsletter, and use extracts from it on your own web
site or other publication, providing the above notice
is included and a link back to our website is in place.
For previous issues by subject see https://www.windmill.co.uk/monitorindex.html
DOWNLOAD DATA ACQUISITION SOFTWARE
As a thank you for subscribing we offer you the ComDebug data logging and Com port trouble-shooting software. Log data over RS232, RS422, RS485 or Modbus. Also included is a month's trial of the Windmill 7 logging, charting and control programs.
SUBSCRIBING OR CANCELLING SUBSCRIPTION Visit https://www.windmill.co.uk/newsletter.html and add or remove your e-mail address.
Windmill Software Ltd, PO Box 58, North District Office,
Manchester, M8 8QR, UK
Telephone: +44 (0)161 834 6688
Facsimile: +44 (0)161 833 2190
E-mail: monitor@windmillsoft.com
https://www.windmill.co.uk/
https://www.windmillsoft.com/