Monitor - ISSN 1472-0221
The Newsletter for Data Acquisition and Control
Issue 271 June 2021
Thanks very much for subscribing. The 17th of June was "Clean Air Day" in the UK, so this month we've an article about monitoring air quality with laser particle counters, and how these fit within a smart city. You can download a pdf copy of the newsletter here.
Contents
* Monitoring air quality with laser particle counters
* Your DAQ Questions Answered: Automatically logging remotely
* Data Acquisition News Round-Up
Monitoring air quality with laser particle counters
Web link: https://www.windmill.co.uk/particle-counters-smart-cities.html
According the the World Health Organization, particulate matter affects more people than any other pollutant and causes over 4 million premature deaths a year.
Sensors using the latest generation of laser particle counters immediately report levels of harmful particulates in the air at specific locations.
Particulate matter (PM) is categorised by size. PM1 is where particles are less than 1µm (0.001 mm), PM2.5 are bigger at ≤ 2.5µm (0.0025 mm) and PM10 larger still at ≤ 10 10µm (0.01 mm).
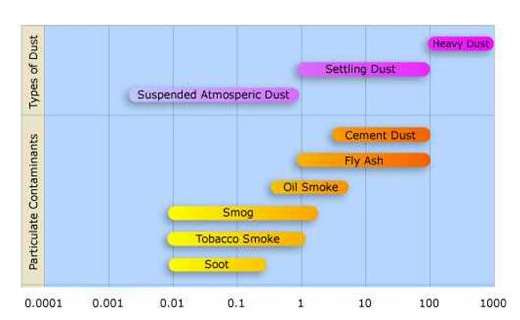
airborne particles. Credit: Jisaac9 CC BY 3.0
Routine air quality measurements typically describe such PM concentrations in terms of micrograms per cubic meter (µg/m3). Sufficiently sensitive measurement sensors can count suspended particles in sizes of 0.3 µm and up. The sensor uses an algorithm to calculate the PM1, PM2.5 and PM10 mass concentrations.
How laser particle counters work
A laser produces a narrow beam of light in which all the light waves have very similar wavelengths and are in phase. This means that laser beams stay focused.
When particles pass through a laser beam they scatter the light. The sensor measures the light scattering to count the number and size of particles in the air. It can then immediately report the concentration of different sized particles.
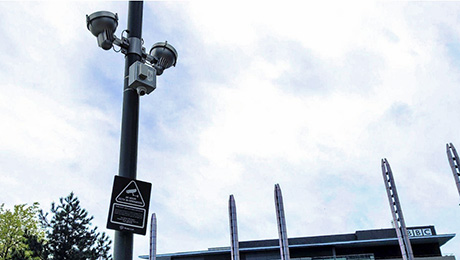
Measuring pollution in Smart Cities over the Internet-of-Things
Air quality monitors using laser particle counters are being used by, for example, Urban Sensing Ltd to suppy real-time data about air pollution in smart cities. They typically mount the sensors on lamp posts around the city. In such systems pollution level data can be instantly reported along with vehicle counts, footfall, temperature, wind speed, humidity and other information. The small size and easy of installation means many monitoring points can be placed around the city - mapping air pollution black spots. This high spatial resolution allows targeted measures to raise air quality.
Reference and Further Reading
Integrating particle counters into Smart Cities: real-time Air Quality Monitoring Windmill Software Ltd, 2021
Monitor air quality in the smart city, Retail Sensing, 2021
How Smart City Sensors Work, Windmill Software, 2020
Ambient (outdoor) air pollution,
World Health Organization, 2018.
Find out More
For more information about integrating particle counters into smart city systems, get in touch.
Your Data Acquisition Questions Answered: Automatically logging remotely
Question
I am installing remote embedded systems in locations which cannot be monitored constantly. The systems will be solar-powered and accessible via mobile modems. The solar charging equipment permits monitoring of charge state, voltages, etc via MODBUS but their software does not support automatic logging of the solar system parameters. Is it possible to use COMDEBUG or other WINDMILL software to simply begin writing MODBUS data to a file upon Windows startup? I'd like to query the solar device once an hour or so and get a few parameters and write them to a file. The file will sit in a directory which is automatically uploaded to a server each night. Is this something your software can do?
Answer
Once you've set up the Windmill software to collect data from your equipment, you can specify Windmill to start automatically.
- On the Windows Start menu, right-click the Windmill Logger icon and choose Properties. (If you don't see the Properties option, choose More and Open File Location. Now right-click and choose Properties.)
- The target box shows where Logger is located. At the end of this line add your Logger setup file (*.wlg) followed by /auto. This means that whenever Logger is loaded it will automatically start logging data.
- Now tell Windows to run Logger on start-up. Open the Windows Start menu, find Windmill and from there right click the Logger icon. Select More then Open File Location.
- Now open the Windows Startup menu. On the keyboard press the Windows logo key + R, type shell:startup, then select OK. This will open your Startup folder.
- Copy and paste the Logger shortcut to the Startup folder.
- Logger will now start collecting data as soon as Windows loads. Data will be appended to the end of the file you specified in the Logger setup file (*.wlg). If you wish to save data to a series of files, see the notes in issue 20 of Monitor.
For more details see https://www.windmill.co.uk/start-at-switch-on.html. Information about reading data from Modbus devices is here.
If any subscriber would like a copy of all the Windmill programs, please email monitor@windmillsoft.com.
DAQ News Round-up
Welcome to our round-up of the data acquisition and control news. If you would like to receive more timely DAQ news updates then follow us on Twitter - @DataAcquisition - or grab our rss feed.
Ultrathin sensors make sense for sustainable farming
Plant probes for monitoring the health of crops could help farmers grow more food without putting extra demands on the land.
Source: KAUST
https://discovery.kaust.edu.sa/
Snails carrying the world's smallest computer help solve mass extinction survivor mystery
This was the first field application for the tiny computer which could track light exposure levels on the back of a snail.
Source: University of Michigan
https://ece.engin.umich.edu/
Imaging technique could help identify where landslides are likely
Magnitude of big landslides is affected by not only local conditions such as slope and precipitation but also forces deep underground. New model can identify places deep below the Earth's surface where rocks are weathered or fractured, and determine which locations are most susceptible to landslides.
Source: UCLA
https://newsroom.ucla.edu/
Using space data to aid offshore renewable marine energy generation
Space data can provide a wide range of information including weather, sea state, environmental impacts, vessel activity and thermal signatures. This will produce direct cost savings, carbon savings and reduction of risk in offshore renewable energy.
Source: SCUBA News
https://news.scubatravel.co.uk
Detecting endangered right whales
New technology which can listen to, and identify, right whales could help protect these extremely endangered animals
Source: SCUBA News
https://news.scubatravel.co.uk/

* Copyright Windmill Software Ltd
* Reprinting permitted with this notice included
* For more articles see https://www.windmill.co.uk/
We are happy for you to copy and distribute this
newsletter, and use extracts from it on your own web
site or other publication, providing the above notice
is included and a link back to our website is in place.
For previous issues by subject see https://www.windmill.co.uk/monitorindex.html
SUBSCRIBING OR CANCELLING SUBSCRIPTION Visit https://www.windmill.co.uk/newsletter.html and add or remove your e-mail address.
Windmill Software Ltd, PO Box 58, North District Office,
Manchester, M8 8QR, UK
Telephone: +44 (0)161 834 6688
Facsimile: +44 (0)161 833 2190
E-mail: monitor@windmillsoft.com
https://www.windmill.co.uk/
https://www.windmillsoft.com/